Do students learn to make graphs?

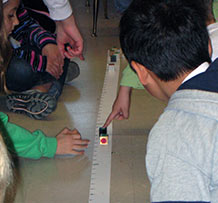
Students learn to represent their data using graphs and drawings, tables, and measure lines. The weight line is an important representation in the 3rd grade curriculum — this is a measure line where the weight of an object is represented by a distance from zero. It’s a great way for young students to organize objects by weight and show how much heavier one object is than another. The use of ratio and proportionality does not come easily for many third graders, however, using the weight line, students can determine if an object is 2X or 3X heavier than another.
The weight line is really helpful as students consider whether tiny things have weight. For instance, many students do not immediately understand that there can be values on the weight line between 3 and 4, or between 0 and 1. Research has shown that students who doubt the existence of numbers between 0 and 1 also doubt that very small pieces of matter have weight. Conversely, those who understand that even invisible pieces of matter have weight also understand that there are an infinite number of values between 0 and 1.
When students repeatedly cut material into smaller pieces and place them on the weight line, they see the need for values between the integers and begin to make the connections between fractions, the number line, and their increasingly smaller measurements of weight.


