Teachers' Knowledge of Science Concepts
Introduction
During the third year of the Talk Science research (2011–2012), we interviewed eleven teachers from Grade 5, who were teaching the Inquiry Project curriculum for the first time. Each teacher was interviewed twice in a pre–post manner, once before teaching the curriculum and once after teaching the curriculum. The interview probed teachers’ understandings of core disciplinary science ideas regarding matter, and examined specifically the development in their ability to draw on the science concepts and principles from the Inquiry Project curriculum in articulating their understandings.
We interviewed the teachers in person or by phone. The pre–interviews took place prior to the teachers’ participation in an implementation workshop organized to help teachers become familiar with the Inquiry Project curriculum. We conducted the post–interviews at the end of the teachers’ participation in the Talk Science program, which included implementing the curriculum in their classrooms.
Interview Design
The science interview consisted of 41 questions, of which 31 questions examined teachers’ knowledge of the science concepts and principles, and 10 questions examined teachers’ interpretation of and how they would follow up on students’ thinking. The interview questions addressed six content areas included in the Inquiry Project curriculum:
- (i) measurement and margin of error;
- (ii) properties of air;
- (iii) phase change;
- (iv) dissolving;
- (v) condensation; and
- (vi) evaporation.
Interview Scoring
We developed a three level scoring scheme to score the depth of teachers’ responses. Teachers’ responses were given a score of 0 if teachers provided incorrect or equivocal responses; a score of 1 if teachers provided correct, seemingly intuitive responses, but without an accurate, complete scientific explanation; and finally, a score of 2 if teachers provided correct responses along with a scientific explanation drawn from the core ideas in the curriculum.
Using this scoring scheme, we calculated the total pre– and post–interview score for each teacher; the total number of pre- and post-interview level 2 responses for each teacher; the pre– and post–interview scores for each teacher in each of the six content areas; and the number of pre– and post–interview level 2 responses for each teacher in each of the six content areas.
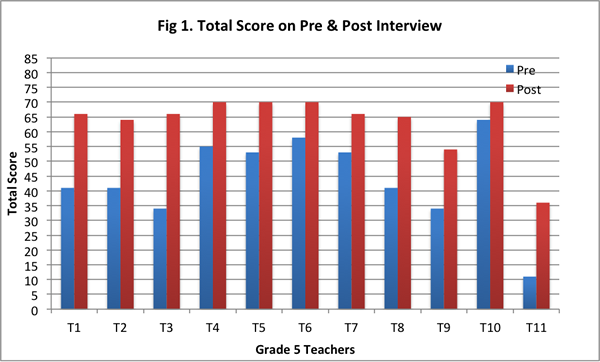
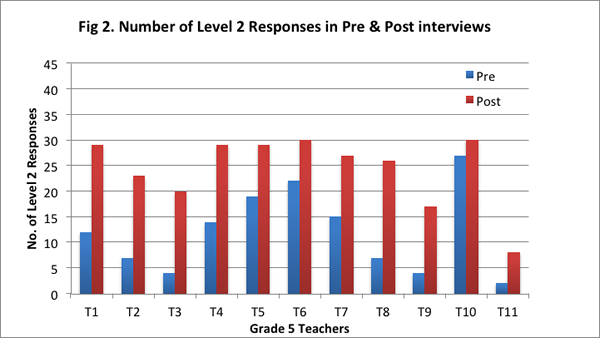
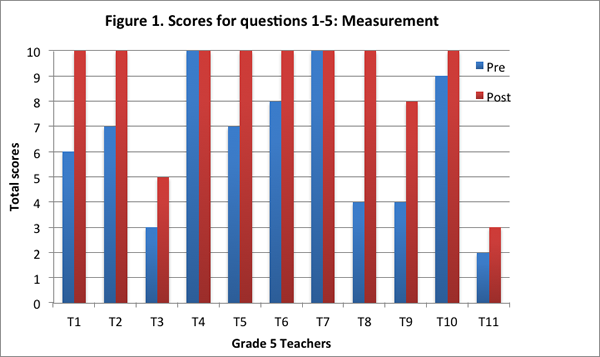
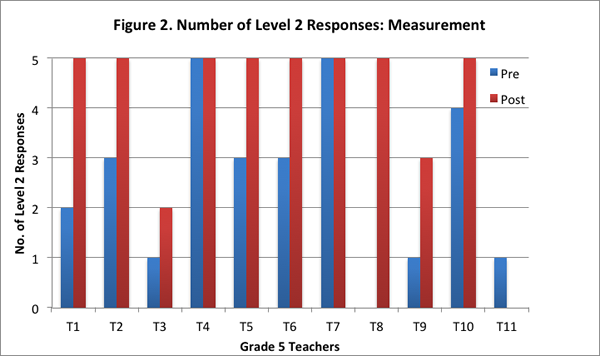
Our findings suggest that after implementing the curriculum as part of the Talk Science program, teachers articulated their understandings about the nature of matter by drawing increasingly on the concepts and principles from the curriculum. They showed greater facility in explaining processes such as evaporation, condensation, and dissolving of salt in water with the help of the particle model from the curriculum, and understood that matter is made of particles that have weight and take up space. On the post–interview, all teachers obtained a higher total score (see Figure 1), and provided more responses that were assigned a score of 2 (see Figure 2; indicating their ability to provide elaborate scientific explanations on the basis of the core science concepts and ideas from the curriculum).
In the following section, we provide details on the changes in teachers’ understandings within each of the six content areas that were examined through the interview.
Interview Findings
Measurement and Margin of Error
This content area contained a set of five questions of which three questions asked teachers to explain the notions of rounding and margin of error in the context of a fictitious scenario in which three groups of students weigh three different size blocks. The remaining two questions in this set addressed teachers’ understandings regarding the difference between volume and weight as a measure of the amount of matter by asking teachers to explain how different volumes of sand from three cylinders could weigh the same.
On the post–interview, teachers improved their ability to articulate a margin of error argument to account for the differences in weight between the sum of the individual weights of three blocks and the weight of the blocks when the three blocks are weighed together. Teachers identified that the difference in these two measurements of weight could be due to the fractional weights of the individual blocks. Furthermore, teachers also articulated the notion of rounding in measurement and added that errors in rounding could occur because the scale measured only to the closest whole gram.
With respect to teachers' thinking regarding weight v/s volume as a measure of the amount of matter, most teachers identified correctly on the post–interview that weight was a more accurate measure of the amount of matter (in this case, of the amount of sand packed in a cylinder). The teachers attributed differences in volume to the way the sand might be packed in the cylinder, and the air spaces between the sand particles.
We found that nine of the eleven teachers obtained a higher score on this content area on the post–interview than the pre–interview (see Figure 1). Two of the teachers obtained the maximum score for this content area on both pre– and post–interviews.
Further, eight teachers provided more level 2 responses on the post-interview than the pre–interview; two teachers provided level 2 responses to all five questions on both pre– and post–interviews; and one teacher did not provide any level 2 response on either the pre–interview or the post–interview (see Figure 2).
Properties of Air
This content area contained a set of three questions addressing the key properties of air as discussed in the Inquiry Project curriculum: air is matter because it has weight and takes up space. The first question asked teachers to explain why they thought air was or was not matter; the second question asked teachers to consider a fictitious scenario in which they are presented with two soccer balls that are initially balanced on the scale, and explain whether the balls would weigh the same or different if one of the balls has more air pumped into it; and finally, the third question served to examine if teachers could transfer their understanding of the properties of air to a different context by explaining why air was thinner at higher altitudes.
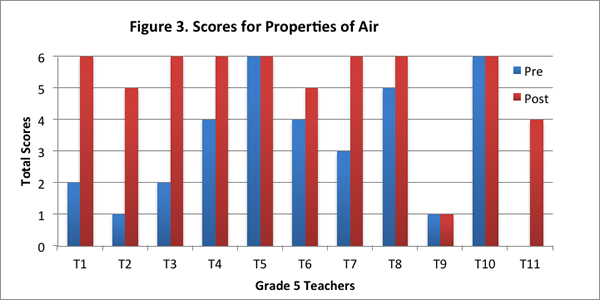
We found that eight of the eleven teachers improved their score for this content area on the post–interview. Two of the teachers obtained the maximum score for this content area on both pre– and post–interviews, and one teacher did not show any difference in her scores (see Figure 3).
In the pre–interview, all but one of the teachers identified that air was matter but only five teachers added that air has weight and takes up space. Five teachers said it was matter but gave less specific reasons, such as air has “properties”; air is made of molecules; air is made of atoms; and gases are matter. Responses of this nature were assigned a score of 1. Of these five teachers, one said air was weightless, one thought air could not be weighed, and one did not know if air had weight. One teacher did not know if air was matter and said air did not have weight.
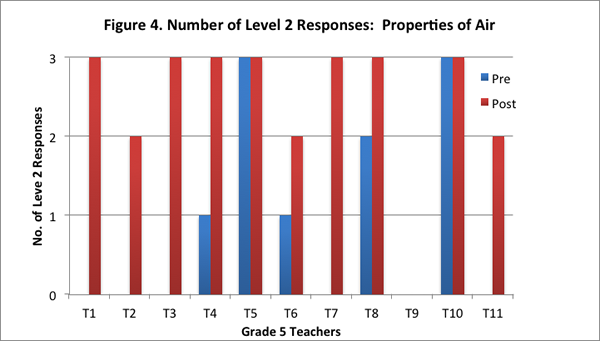
On the post interview, most of the teachers identified correctly that air was matter and that it was made of particles that had weight and took up space. Seven of the eleven teachers provided level 2 responses to all three questions on the post–interview (see Figure 4). These teachers identified correctly that air is matter because it has weight and takes up space. Further, these teachers also articulated that adding air to an already inflated soccer ball would make the ball heavier.
Furthermore, in answering the transfer question on the post–interview, seven of the eleven teachers drew on the particle model developed in the curriculum to suggest that the air particles were likely further apart at higher altitudes.
Characteristics of Phase Change
This content area contained a set of seven questions addressing the characteristics of phase change and the conservation of matter.
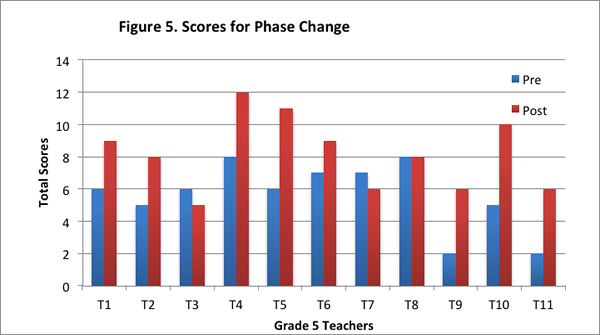
On the post–interview, the teachers improved in their understanding of phase change and conservation of matter. The teachers identified that phase change referred to a substance moving between a solid, liquid, and gas. They also articulated the key characteristic of phase change emphasized in the curriculum: weight stays the same even though volume can change. The teachers’ improvement in their understanding of phase change is evidenced in both their improved scores for this content area, and the greater number of level 2 responses for this content area on the post–interview than the pre–interview.
On the post–interview, eight of the eleven teachers had higher scores for this content area than the pre–interview; two teachers had lower score than the pre–interview; and one teacher’s score was the same on the pre– and post–interview (see Figure 5).
Furthermore, ten of the eleven teachers provided more level 2 responses on the post–interview than the pre–interview (see Figure 6).
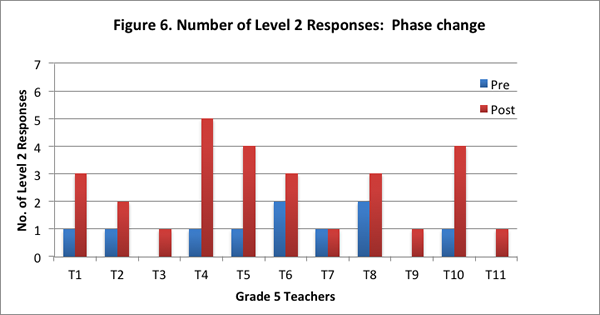
Teachers’ responses also revealed that there were certain aspects of phase change they did not always articulate clearly. For example, in answering the question “What is phase change”, ten of the eleven teachers in the post–interview stated only that phase change involved a material changing states, but did not include the key features of phase change in their response: material stays the same; weight stays the same; reversibility; the particle movement is different in the different phases. Please refer to the NSF research report for more details.
Dissolving
This content area contained ten questions asking teachers to consider what happens when salt dissolves in water. Six of the questions inquired into teachers' knowledge pertaining to the particle model of matter described in the curriculum, and four questions inquired into teachers' understanding of students' thinking, and how they would respond to students' ideas. The latter set of questions asked teachers to consider a fictitious classroom scenario in which two students discuss whether or not the volume increased when salt was added to water, and if their finding would provide evidence of whether or not the salt remained in the water.
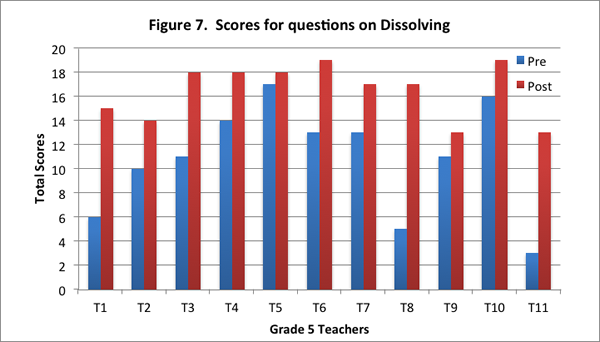
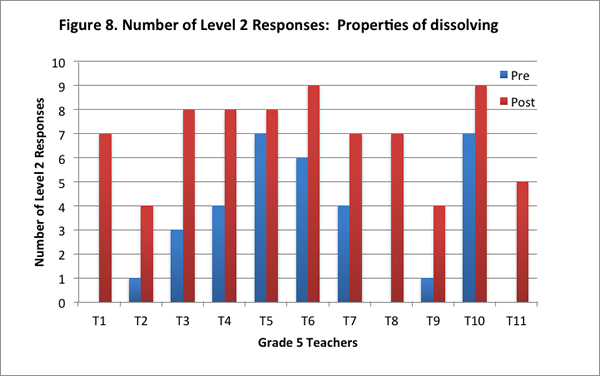
All teachers in the post–interview improved in their understanding of this content area. Most teachers drew on a particle model in the post–interview to describe the process of dissolving: Eight of the eleven teachers identified that salt particles break apart and are too small to be seen when salt is dissolved in water. On the post–interview, teachers also identified weight as a measure of the amount of salt in the water. When asked for ways to test the presence of dissolved salt in the water, nine of the eleven teachers described the method emphasized in the curriculum: weigh the salt and water separately, and then weigh the water and salt together.
Teachers’ improved understandings are evidenced in the increase in their scores for this content area on the post–interview, and in the increase in the number of level 2 responses on the post–interview (see Figures 7 and 8).
Condensation
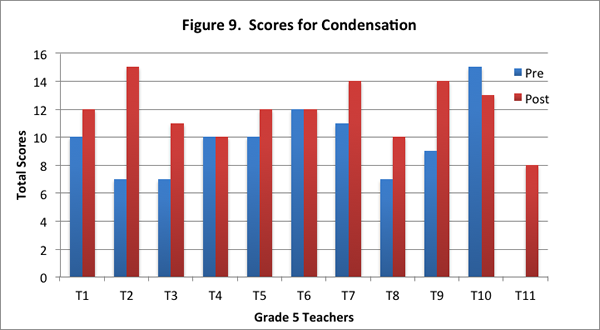
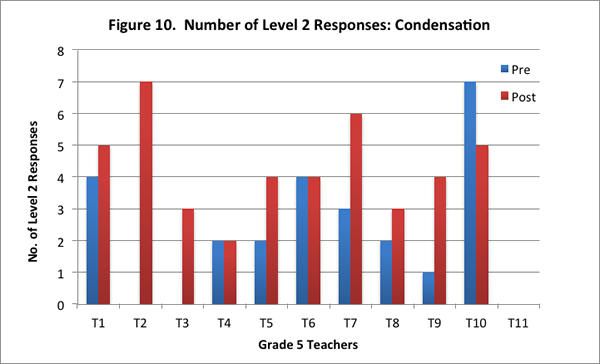
This content area contained eight questions asking teachers to consider a concept cartoon that showed condensation on a glass of water with ice cubes, and no condensation on a glass of water without ice cubes. Of these eight questions, five questions examined teachers’ understanding of condensation in terms of the particle model, whereas three questions asked teachers to consider the three conflicting student perspectives presented in the concept cartoon.
In this content area, teachers showed overall improvement on the post–interview in responding to the concept cartoon. Eight of the eleven teachers had higher scores on the post–interview (see Figure 9), and seven of the eleven teachers provided more level 2 responses on the post–interview (see Figure 10).
Specifically, in the post-interview, more teachers were apt to draw on the particle model introduced in the curriculum, thereby demonstrating deeper reasoning about the science. This shift towards thinking in terms of the underlying water particles is exemplified in the explanation by one of the teachers on the pre– and post–interviews, when asked why water droplets formed on one glass but not on the other as depicted in the concept cartoon:
Pre-interview response: “The other one is cold; and therefore the warm air coming from its surroundings hits the glass and that’s how condensation is created.”
Post-interview response: “Oh, condensation. Because the ice cubes create a temperature difference, and that causes molecules from the air to draw near to the glass because water molecules that are in the air in the warm temperature are free–floating, but as the temperature cools, they want to come together. As they come together towards where the glass is, they puddle.”
In responding to the concept cartoon, more teachers tended to focus on evaluating the accuracy of students’ thinking as depicted in the concept cartoon, and were less inclined to ponder the possible reasoning underlying students’ ideas. When asked to consider the students’ ideas presented in the concept cartoon, few teachers articulated responses such as the following:
“[Lila] is thinking that the water is leaking somewhere, and she’s thinking about water inside the glass only. She’s not thinking about water outside the glass, and so therefore she’s feeling like the only place where there is water is from the glass.”
“So I, I’d like some evidence of why [Deneb] thinks that [the water came over the glass]. Where is the water that moved over the top of the glass and is dripping down the side? Did he not see that at all? Did he not see it happen to start? Or are, these three kids are just coming right to the table, so he’s assuming something.”
Evaporation
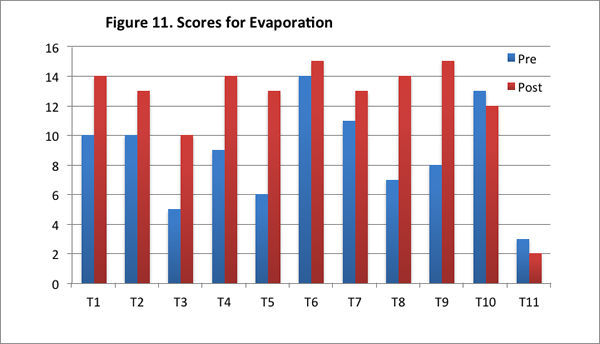
This content area contained eight questions in the context of a concept cartoon, of which five questions tapped into teachers' knowledge regarding evaporation, and three questions addressed teachers' understanding of the student ideas presented in the concept cartoon.
The findings show that overall, teachers’ scores for this content area improved on the post–interview. On the post–interview, teachers increasingly understood evaporation as a process whereby water moves from a liquid state to a gaseous state, and were inclined to reference the particle model to explain evaporation in terms of the water particles breaking or spreading apart. On the post–interview when asked to think of ways to test the competing ideas in the concept cartoon, teachers also referred increasingly to the two–bottle system experiment introduced in the curriculum.
Furthermore, our findings suggest that in the post–interview, more teachers engaged deeply with pondering student ideas presented in the concept cartoon. More teachers in the post–interview than the pre–interview attempted to make sense of the canonically inaccurate student ideas in the concept cartoon. Teachers tried increasingly to speculate the reasoning underlying the ideas in the concept cartoon.
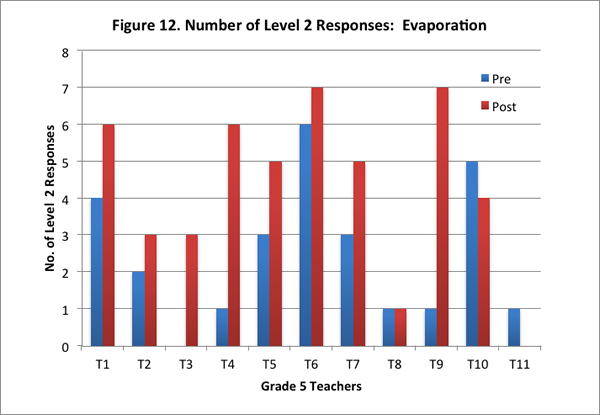
Teachers’ improved scores for this content area are reflected in an increase in their total scores for this area, and in the greater number of level 2 responses on the post–interview. Of the eleven teachers, nine teachers had higher scores in the post–interview than the pre–interview (see Figure 11); further, eight of the eleven teachers offered more level 2 responses in the post–interview than pre–interview (see Figure 12).