Task 3: Different Ratios
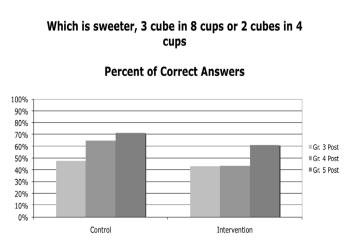
In task 3 children had to compare two different ratios, with different values for each variable. Again, the Control group performed better than the Intervention group (Figure 16). Approximately one third of the children justified correct answers (a) by comparing the ratio between the number of sugar cubes with the ratio between the number of cups of water (as in the following examples: “In E there is double the water but not double the sugar”; "4 is half of 8, but 2 is more than half of 3) or (b) by comparing the ratios of sugar to water (“F has 1 sugar cube for 2 cups water, E has less than 1 sugar cube for 2 cups water.”)
In answering the question “Is there any way we could make them taste the same even though they have different amounts of sugar?” the Control group’s performance systematically improved from grades three to five, with more children in higher grades proposing solutions that would make the two mixtures have the same ratio of sugar to water, even though the amounts were different. For the Intervention group, the trend is less clear, but still more children proposed equal ratios in higher grades.