How can we describe our personal objects?
3. Make meaning
Purpose of the discussion
Students have collected a lot of data and the purpose of this discussion is have them help each other come up with statements (claims) about the whole collection of personal objects and point to the data that back up the claim (evidence). The discussion will help them use data to answer the investigation question, How can we describe our personal objects? Analyzing and interpreting data is an essential scientific practice.
Take 5 minutes for a few volunteers to share their descriptions of their own objects, using the data sheet in their notebooks. As they do, point to the representations of their individual data in the class histograms and the location of their object on the weight line.
Engage students in the focus question
Keeping attention on the histograms and weight line, recall the investigation question:
“How can we describe our personal objects?”
Look at all the data with the students.
- How could we describe the whole collection of objects?
[Make Claims] The shift from describing a single object to describing a collection of objects is likely to be new for students, but as they study the data representations, they can be guided toward some simple, general observations about the entire data set.
What can we say about the number of materials our objects are made of?
- They can figure out that each bar on the histogram is a different material so counting the bars tells you the number of materials.
There are 14 different materials in our collection.
Most of our objects are made of just two materials.
What can we say about the kind of materials our objects are made of?
- They can look at the height of the bar(s) to see which materials appear more frequently.
The most common materials are plastic and wood. These materials don’t break when you bring objects to school.
What can we say about the weight of the objects in our collection?
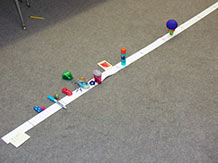
Like the histograms, this weight line is a representation of data. It shows not only the actual weights of the objects but also the relationships between the weights of different objects. For example, students can see the range between the lightest and heaviest objects and how the objects are distributed along that range. Are there clusters of objects? Where do they fall?
- They can discover the highest and lowest values in the weight data set, as well as the range of weights, as well as measures of central tendency.
The heaviest object weighs _X_ grams.
The lightest one weighs only _Y_ grams.
The heaviest object is _Z_ grams heavier than the lightest one.
Most objects are between _A_ and _B_ grams.
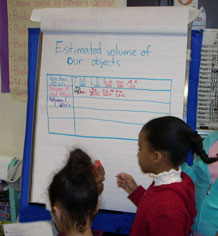
What can we say about the volume of the objects in our collection?
- They can discover clusters of weights, volumes, or materials.
Most of our objects have a volume that is less than 100 cubic centimeters.
As you model generalizations, check that the students understand the relationship between the claim and the data (evidence).
- Would you point to the place on the graph where you found this information?
As students make claims, record the claim statements in a place where all can see the growing description of the set of personal objects. When the list is complete, ask students to suggest an explanation.
- When we collected data on all our of our 26 objects, we see that plastic and wood are the materials used most often, their weights are between _X_ and _Y_, most have volumes between 10 and 100 cubic centimeters. Can you think of an explanation for why this would be true of our collections of objects?
- How did these graphs and the weight line help us describe our whole collection of objects?
Congratulate students on their careful and thoughtful work as scientists!