How can we describe our personal objects?
Plan Investigating Volume 4
Materials … Weight … Standard Measures … Volume. The students have covered a lot of territory in their study of matter. In this capstone investigation, they apply their skills and understandings to a final task — fully describing the “personal objects” they brought to the first class.
Students first record some data about the materials, weight and volume of their personal objects. They then consider the entire collection of objects, graphing the range of data and placing all the objects on a weight line. This shift from describing a single object to describing a collection of objects is likely to be new for them. By the end of the investigation, they will be making some simple, general observations about the whole set of personal objects, describing common properties and using standard metric measures.
Learning Goals
- to use skills and concepts related to materials, weight, and volume
- to get more experience with data representations (graphs and the weight line)
| Sequence of experiences | ||
|---|---|---|
| 1. Ask the question | All Class | 10 Mins |
| 2. Collect and record data about our objects | Small Groups | 20 Mins |
| 3. Make meaning | Discussion | 15 Mins |
* It is possible for this investigation to be performed within 45 minutes. However, it is recommended that Step 1 and Step 2 be completed within one session as collecting the data can often take longer than expected. Step 3 can be completed in a subsequent session along with any additional reflections you would like to complete this unit.
Materials and Preparation
For the class:- Post the investigation question in a place where all students can see it.
- Histogram 1: Number of Materials in Our Objects
- Histogram 2: Materials Our Objects are Made of
- Histogram 3: Estimated Volume of Our Objects
- The class weight line
- 3 volume reference blocks: 1, 10, 100 cubic centimeters (see the photo in Step 2).
- 10 cubic centimeter reference is created by taping 10 centimeter cubes together
- 100 cubic centimeter reference is created by taping 5 maple blocks labeled B (20 cubic centimeters) together
- 1 gram weight set
- 2 pan balances
- 1 personal or classroom object
1. Ask the question
Have the children retrieve their personal objects and hold them up for all to see.

Students may need help estimating volumes. You can create reference volumes from the centimeter cubes and maple blocks in your kit. The volumes created above are 1 cubic centimeter (1 cube), 10 cubic centimeters (10 cubes taped together), and 100 cubic centimeters (5 maple “B” blocks taped together).
- What if you had to describe your object to someone far away who could not see it? How would you do it? How would a scientist do it?
As students share their ideas, recall some of the ways they have learned to describe objects in this unit, mentioning materials, weight, and volume.
- Can you estimate how much your object weighs?
- Can you estimate its volume?
- What can you say about the materials?
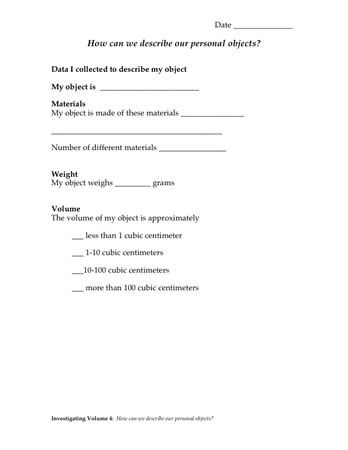
Have students review the data–recording sheet. Let them know they will spend the whole class recording information about their objects and then considering how they are all alike and different. Point out the pan balances, the blocks you've set up to help them estimate volumes, the weight line where they will array their objects, and the histograms where they will enter their data.
Finally, share the investigation question with the students:
2. Collect and record data about our objects
Students weigh, measure, estimate volumes, and consider the materials that make up their objects. The data log in their science notebooks will guide them through the task of data collection.
You can help by:
- Watching for logjams at the pan balance and volume stations
- Helping students identify materials that are unfamiliar to them
- Reminding students how to use the gram weights if they are having trouble
- Helping estimate volumes, using the three volume blocks for reference (note that students are asked only for the range into which their object falls: less than 1cc, 1–10 cc, 10–100 cc, more than 100 cc)
Crowd control: Having each person in a group start with a different measurement or observation will minimize the time students need to wait to use the pan balance or the volume blocks.
As students finish recording their data in their notebooks, ask them to share it with the class by
- entering the materials data and volume data in the class histograms
- putting their object in its proper place on the weight line.
You can help by demonstrating how to build the histograms, i.e., by entering students initials in the proper row or column, making sure the initials are written at about the same size, as shown in the examples.
Note: By comparing the heights of the columns of initials in Histograms 1 and 2, students can quickly see how their objects make use of different materials.
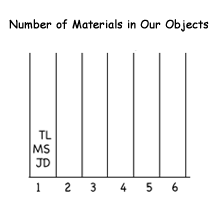
Histogram 1: Number of Materials in our Objects
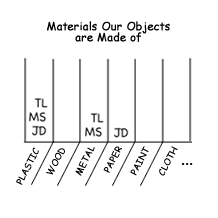
Histogram 2: Materials Our Objects are Made of
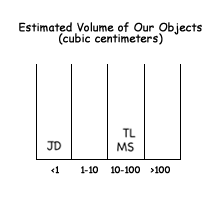
Histogram 3: Estimated Volume of Our Objects
Once all the volume data has been added, students can see where there are clusters of data and get a general picture of how the volumes of the personal objects are distributed across the four categories.
3. Make meaning
Purpose of the discussion
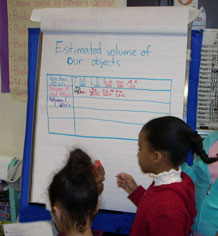
Students have collected a lot of data and the purpose of this discussion is have them help each other come up with statements (claims) about the whole collection of personal objects and point to the data that back up the claim (evidence). The discussion will help them use data to answer the investigation question, How can we describe our personal objects? Analyzing and interpreting data is an essential scientific practice.
Take 5 minutes for a few volunteers to share their descriptions of their own objects, using the data sheet in their notebooks. As they do, point to the representations of their individual data in the class histograms and the location of their object on the weight line.
Engage students in the focus question
Keeping attention on the histograms and weight line, recall the investigation question:
“How can we describe our personal objects?”
Look at all the data with the students.
- How could we describe the whole collection of objects?
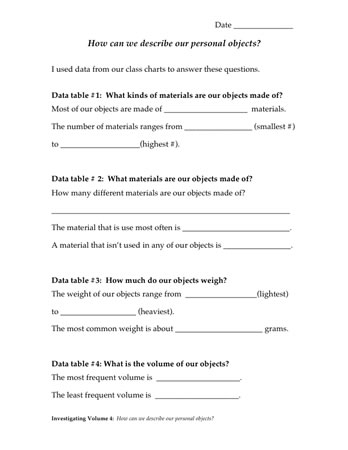
[Make Claims] The shift from describing a single object to describing a collection of objects is likely to be new for students, but as they study the data representations, they can be guided toward some simple, general observations about the entire data set.
What can we say about the number of materials our objects are made of?
- They can figure out that each bar on the histogram is a different material so counting the bars tells you the number of materials.
There are 14 different materials in our collection.
Most of our objects are made of just two materials.
What can we say about the kind of materials our objects are made of?
- They can look at the height of the bar(s) to see which materials appear more frequently.
The most common materials are plastic and wood. These materials don’t break when you bring objects to school.
What can we say about the weight of the objects in our collection?
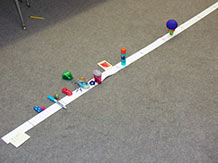
Like the histograms, this weight line is a representation of data. It shows not only the actual weights of the objects but also the relationships between the weights of different objects. For example, students can see the range between the lightest and heaviest objects and how the objects are distributed along that range. Are there clusters of objects? Where do they fall?
- They can discover the highest and lowest values in the weight data set, as well as the range of weights, as well as measures of central tendency.
The heaviest object weighs _X_ grams.
The lightest one weighs only _Y_ grams.
The heaviest object is _Z_ grams heavier than the lightest one.
Most objects are between _A_ and _B_ grams.
What can we say about the volume of the objects in our collection?
- They can discover clusters of weights, volumes, or materials.
Most of our objects have a volume that is less than 100 cubic centimeters.
As you model generalizations, check that the students understand the relationship between the claim and the data (evidence).
- Would you point to the place on the graph where you found this information?
As students make claims, record the claim statements in a place where all can see the growing description of the set of personal objects. When the list is complete, ask students to suggest an explanation.
- When we collected data on all our of our 26 objects, we see that plastic and wood are the materials used most often, their weights are between _X_ and _Y_, most have volumes between 10 and 100 cubic centimeters. Can you think of an explanation for why this would be true of our collections of objects?
- How did these graphs and the weight line help us describe our whole collection of objects?
Congratulate students on their careful and thoughtful work as scientists!


