What can a good weight line show us about our earth materials?
Plan Investigation 2.3

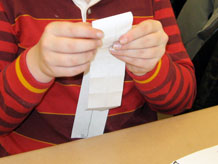
Students now have some weight data, and they have some rules for making a good weight line. They are ready for the next challenge: Construct a weight line that will help them see — really see — how much heavier some earth materials are than others.
Formative Assessment
Do students understand that a table and a weight line can represent the same data set?
Available online at inquiryproject.terc.edu
As they work through the challenge, students apply their rules, grapple with some geometry and arithmetic, and consider what their weight line shows them about their earth materials. They then compare the two ways they have represented their data: in the data table and on the weight line. Then also try to solve some weight line puzzles. By the end of the investigation, students will have a better visual understanding of what it means to be "heavy for size."
Learning Goals
- Recognize that data tables and weight lines can both display weight data
- See that a weight line is a good way to show how much more one thing weighs than another
| Sequence of experiences | ||
|---|---|---|
| 1. Ask the question | All Class | 5 Mins |
| 2. Build weight lines | Individual | 20 Mins |
| 3. Reflect | Discussion | 10 Mins |
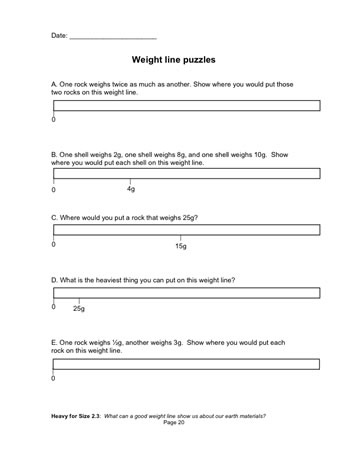
| 4. Weight line puzzles | All Class | 10 Mins |
Materials and Preparation

For the class:
- Post the investigation question in a place where all students can see it.
- Class data table for earth material weights (from the first investigation)
- Class list of rules for a good weight line (from the last investigation)
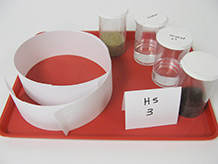
For each tray:
- 1 capped 150cc container with exactly 40cc of fresh water (from the last investigation)*
- 1 capped 150cc container with exactly 40cc of mineral oil (from the last investigation)*
- 1 capped 150cc container with 40cc of sand (from the last investigation)*
- 1 capped 150cc container with 40cc of organic soil (from the last investigation)*
- 4 strips of adding machine tape; strips can vary in length from 40-60 cm.
Notebook Pages
Do students understand that a table and a weight line can represent the same data set?
Observing and listening to students as they use data from their notebooks to construct their own weight lines and place samples of earth materials on the line will provide evidence of understanding.
As you interpret the evidence ask, are students able to:
- Find the weight of each sample of earth material in the data table?
- Locate this measurement on the weight line?
- Place the container in the appropriate spot?
- Describe how the weight line shows how much heavier on sample is than another?
As a next step, ask students to whether they prefer looking at their weight data in a table or a weight line and explain why.


