What can a good weight line show us about our earth materials?
3. Reflect
Purpose of the discussion
This discussion has two purposes: first to use the weight line data to make claims about how the weight and volume of the four materials compare, and second to compare the information revealed by two different representations of the data, the weight line and the data table.
Engage students in the focus question
Return to the investigation question with one or more of the student weight lines visible for all to see.

What can a good weight line show us about our earth materials?
Students should be able to see clearly that some materials are much heavier than others, while others are nearly equal in weight. Perhaps someone will notice that weight seems to be independent of whether the material is a solid or a liquid (i.e., the two liquids fall between the two solids on the weight line). Some students might observe that when they place the containers on the weight line, they can see that the volumes are the same but the weights are different. This can help confirm that some materials are "heavy for size."
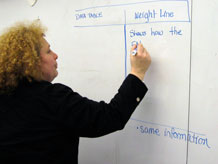
Give students some time to compare the two representations of their weight data, i.e., the class data table that they created in the first session, and the weight lines they just built, which are holding the containers of earth materials.
- What is the same about a data table and a weight line?
- One example: Both show that earth materials of the same volume have different weights. Both show that sand is heaviest for its size, followed by water, mineral oil, and then organic soil.
- Can the weight line reveal information we can’t see in a table?
- One example: When we put the containers on the weight line, we can actually see that they are all filled to the same level, which shows the volume of the material, and see the distances between the containers on the weight line, which show how their weights compare.
- Does the table reveal information we can’t see in the weight line?
- One example: It’s easier to see the actual weights in the table, and to compare them to one another.
Summarize the discussion
In summarizing the discussion emphasize two points:
- The weight line is a tool that not only helps us to make measurements, but to make comparisons.
- Both the weight line and the data table are important ways to represent the data. Each has its own advantage.


