What can a good weight line show us about our earth materials?
Plan Investigation 2.3
Students now have some weight data, and they have some rules for making a good weight line. They are ready for the next challenge: Construct a weight line that will help them see — really see — how much heavier some earth materials are than others.
Formative Assessment
Do students understand that a table and a weight line can represent the same data set?
Available online at inquiryproject.terc.edu
As they work through the challenge, students apply their rules, grapple with some geometry and arithmetic, and consider what their weight line shows them about their earth materials. They then compare the two ways they have represented their data: in the data table and on the weight line. Then also try to solve some weight line puzzles. By the end of the investigation, students will have a better visual understanding of what it means to be "heavy for size."
Learning Goals
- Recognize that data tables and weight lines can both display weight data
- See that a weight line is a good way to show how much more one thing weighs than another
| Sequence of experiences | ||
|---|---|---|
| 1. Ask the question | All Class | 5 Mins |
| 2. Build weight lines | Individual | 20 Mins |
| 3. Reflect | Discussion | 10 Mins |
| 4. Weight line puzzles | All Class | 10 Mins |
Materials and Preparation
For the class:
- Post the investigation question in a place where all students can see it.
- Class data table for earth material weights (from the first investigation)
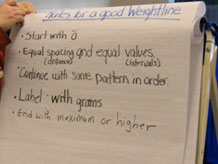
- Class list of rules for a good weight line (from the last investigation)
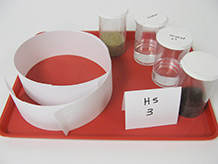
For each tray:
- 1 capped 150cc container with exactly 40cc of fresh water (from the last investigation)*
- 1 capped 150cc container with exactly 40cc of mineral oil (from the last investigation)*
- 1 capped 150cc container with 40cc of sand (from the last investigation)*
- 1 capped 150cc container with 40cc of organic soil (from the last investigation)*
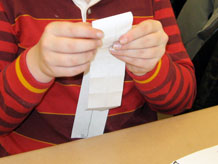
- 4 strips of adding machine tape; strips can vary in length from 40-60 cm.
Notebook Pages

Do students understand that a table and a weight line can represent the same data set?
Observing and listening to students as they use data from their notebooks to construct their own weight lines and place samples of earth materials on the line will provide evidence of understanding.
As you interpret the evidence ask, are students able to:
- Find the weight of each sample of earth material in the data table?
- Locate this measurement on the weight line?
- Place the container in the appropriate spot?
- Describe how the weight line shows how much heavier on sample is than another?
As a next step, ask students to whether they prefer looking at their weight data in a table or a weight line and explain why.
1. Ask the question
Recall the last two investigations. In the first one, students weighed four samples of earth materials and entered the data in a class table. In the second one, they thought of some good rules for weight lines.
Today, they will make their own weight lines and use them to plot their data. Ask students to imagine how the project will go. If they need help, refer them to the class list of rules from the previous investigation.
- Where will you find the weight data?
- What will you do first? Then what?
- What do you think will be the hardest part?
- What do you think you might learn?
Introduce the investigation question:
What can a good weight line show us about our earth materials?
2. Build weight lines
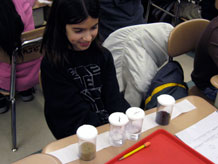
Distribute a tray of materials to each group and remind students of the contents of the containers: equal volumes of water, mineral oil, sand, and organic soil. Ask them to open their notebooks and locate their weight data and their rules for good weight lines.
The hardest part of building the weight line will be determining the interval to use between weight marks, and then to ensure that the intervals are evenly spaced on the line. The interval must be large enough to accommodate the necessary range on the strip of paper, and it must also be easy to work with. Some students may arrive at a good interval through trial and error. Others may use a folding technique, or arithmetic, or some combination of these (see box). As you circulate among the groups, listen to their strategies and head off any serious errors.
When students are satisfied with their weight lines, have them place the containers of materials in the appropriate places.
Geometry, arithmetic, trial and error: three good strategies. A simple way to ensure that the intervals are reasonable and evenly spaced is to use geometry. Fold the paper strip in half to find the middle, fold again to find the quarter points, and continue halving by folding until there are intervals of reasonable size. With fourth graders, it's important to have a range that can be halved several times before getting fractions. If the range is 0 to 70 grams, the first fold will mark 35g, but the second fold will create intervals of 17.5g — not very helpful! If you use a range of 0 to 80 grams instead, successive folds will create intervals of 40g, 20g, 10g, and 5 g before running into fractions.
Another approach involves more planning, some arithmetic, and a measuring tape or ruler. If the paper strip is 40cm long, and the range is 0 to 70 grams, and the goal is to have a mark every 5g, you will need 14 intervals (70/5=14) of 2.85cm each (40/14=2.85). Round down to 2.5cm to simplify the measuring, then space the 5g intervals 2.5cm apart. The resulting weight line will use less than the full length of paper, but it will be manageable.
Students may arrive at some combination of these approaches, e.g., they could start by folding once or twice and then measure or make estimates to create smaller intervals. They could also use a ruler and a trial-and-error approach to creating the equal intervals.
3. Reflect
Purpose of the discussion
This discussion has two purposes: first to use the weight line data to make claims about how the weight and volume of the four materials compare, and second to compare the information revealed by two different representations of the data, the weight line and the data table.
Engage students in the focus question
Return to the investigation question with one or more of the student weight lines visible for all to see.
What can a good weight line show us about our earth materials?
Students should be able to see clearly that some materials are much heavier than others, while others are nearly equal in weight. Perhaps someone will notice that weight seems to be independent of whether the material is a solid or a liquid (i.e., the two liquids fall between the two solids on the weight line). Some students might observe that when they place the containers on the weight line, they can see that the volumes are the same but the weights are different. This can help confirm that some materials are "heavy for size."
Give students some time to compare the two representations of their weight data, i.e., the class data table that they created in the first session, and the weight lines they just built, which are holding the containers of earth materials.
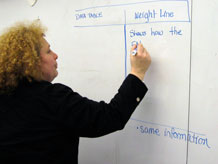
- What is the same about a data table and a weight line?
- One example: Both show that earth materials of the same volume have different weights. Both show that sand is heaviest for its size, followed by water, mineral oil, and then organic soil.
- Can the weight line reveal information we can’t see in a table?
- One example: When we put the containers on the weight line, we can actually see that they are all filled to the same level, which shows the volume of the material, and see the distances between the containers on the weight line, which show how their weights compare.
- Does the table reveal information we can’t see in the weight line?
- One example: It’s easier to see the actual weights in the table, and to compare them to one another.
Summarize the discussion
In summarizing the discussion emphasize two points:
- The weight line is a tool that not only helps us to make measurements, but to make comparisons.
- Both the weight line and the data table are important ways to represent the data. Each has its own advantage.
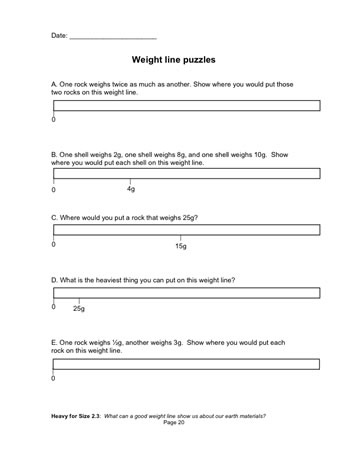
4. Weight line puzzles
Ask students to try the weight line puzzles in their notebooks [Weight line puzzles]. The puzzles will give them a chance to practice putting the rules to use. Try solving the first two puzzles together as a class and then have students work on the rest individually or in pairs.