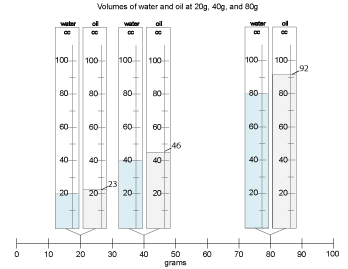
How do oil and water compare?
3. Share weight and volume data

Ask the students to come to the class weight line with their notebooks and their containers of oil and water. Have each group place their containers at the appropriate point on the line (there will be duplicates).
- What do you notice?
Students may struggle a little to see the weights and volumes, but there should be consensus that the volumes are increasing as the weights increase. They may or may not be able to tell much about how the volumes of the oil and water samples compare.
Chart data (optional)
Let's look at the data another way. Let's take the weight and volume data from your notebooks and put it on a class chart.
Have students open their notebooks [When weights are equal, what’s the volume?]. Point out that this is the same chart as the class chart, only sideways.
- How does this chart work?
- Where should we put the volume data for the 20 grams of water?
Record data for all the samples on the chart, resolving any disputed findings as you go along. Have students record the data in their notebooks. The chart will look much like this.


