What's the story behind the graph?
Plan Investigation 17
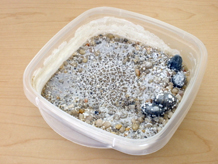
Students have kept track of their mini-lakes throughout this unit. They measured the contents, speculated on the changes that might occur over time, added salt, and tracked weight changes across time as the water evaporated. Today they tell the story of the mini-lakes by annotating their graphs. The annotations should allow someone unfamiliar with their work to understand the transformations of the mini-lakes at two different scales: the macroscopic or visible scale, and the microscopic or particle scale. Students then combine their annotations on a class graph. That sharing should result in a robust story that helps everyone strengthen their understanding of the mini-lake transformations.
Formative Assessment
Can students annotate their change over time graphs to explain changes in their mini-lakes?
Available online at inquiryproject.terc.edu

Can students annotate their change over time graphs to explain changes in their mini-lakes?
Look at students’ annotated graphs (Weight of mini-lake over time) and listen for evidence as they discuss the changes in the mini–lake weights.
Use these criteria to interpret students’ annotations and explanations:
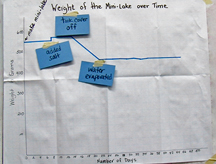
- The shape of the data: A horizontal (flat) line represents no change in weight, a sloped line represents an increase or decrease in weight.
- When the mini–lake is a closed system (the cover is on), there is little or no change in weight (horizontal line).
- When salt is added, the weight increases immediately (line rises vertically).
- When the cover is removed, the weight decreases over time (downward sloping line) until there was no more water left to evaporate (horizontal line).
- Fluctuations in weight (+/- 1 gram) can be attributed to the inaccuracy of the scale.
- The weight of the water put in the mini-lake initially (in data table) is the amount of weight lost through evaporation.
As a next step, ask students if they can think of one or two ways the story of their mini-lake might be the same as the story behind the Ships in a Field.
Next students return to the mystery of the ship in the field. They read the story of the transformation of the Aral Sea, which has some interesting connections with the transformation of the mini-lakes: in both cases, the water that evaporated was not replenished. In both cases, sand, salt, and other solid earth materials were left behind.
By the end of this session students will have a deeper understanding of how the scientists' model of matter (matter made up of particles too small to see ) can explain familiar, everyday transformations such as evaporation, freezing, melting, condensation, and even the disappearance of water from a huge lake!
Learning Goals
- Understand that the particle model of matter explains transformations of water at the visible level
| Sequence of experiences | ||
|---|---|---|
| 1. Ask the question | All Class | 10 Mins |
| 2. Annotate the graphs | Pairs | 10 Mins |
| 3. Share and discuss | Discussion | 15 Mins |
| 4. Connect mini-lakes and real lakes | All Class | 10 Mins |
Materials and Preparation
- Read the student resource Why are these ships in a field? The Story of the Aral Sea [in pdf format] (Available in the Resource Quick Links)
For the class:
- Post the investigation question in a place where all students can see it.
- Create an unlabeled reproduction of the mini-lake weight-over-time graph. This does not need to be scaled accurately.
- Set of images of ships in a field" or notebook pages. [in pdf format]
- Computer and a system for projecting the images if using electronic presentation.
For each student:
- 1 copy of Why are these ships in a field? The Story of the Aral Sea [in pdf format] (See Resources Quick Links)
1. Ask the question

Ask students to open their Science Notebooks to the graph they have created that records the weight of the mini-lake across time.
Today's investigation question is:
What is the story behind the graph?
Students will answer that question by annotating their graph, writing short notes directly on the graph and in the margins around it. These notes should tell the story of the mini-lake to someone who is not familiar with the work students have done over the past several weeks.
Note: The story of change in the mini-lakes can be told at different scales. At the visible scale, the terms dissolving and evaporation can describe most of the changes. However, students have started to learn what happens at the particle scale as these transformations occur. Emphasize that as students annotate their graphs, they should describe what is happening at both the visible level (salt dissolved, water evaporated, etc.) and at the particle level.
The graph shows changes in weight across time. Student notes should explain:
- Where the weight comes from?
- What changed and what stayed the same across time?
- Why the changes happened?
- Any other information students think will be helpful.
Students' notes should tell the story at two scales: at the visible scale (what we can see) and at the particle scale (things we can't see, but have learned about during the past few weeks.) You may choose to have students annotate events at the visible scale individually or in pairs and describe what happened at the particle level on the class graph in Step 3.
Students should make use of any notes they entered in their data table.
2. Annotate the graphs

Mini-lake pairs should discuss the data and contribute ideas for annotating the graphs, but each student should annotate his or her own graph. It's not essential that everyone complete the annotations. The class will combine their notes on the large class drawing of a graph and students can continue to add notes to their own graphs at that same time.
Ask students to annotate observable changes such as the created of mini-lake, added salt, took off cover, water evaporated. They can also note explanations for the "shape" of the line. For example a horizontal line means the weight didn't change (no matter was added or taken away from the mini-lake), a line that slopes upwards shows that the weight increased (due to the addition of salt), a line that slopes downward indicates a loss of weight (due to evaporation of water).
3. Make Meaning

Purpose of the discussion
Students combine their notes on the classroom graph to explain the story behind the graph.
Engage students in the focus question
What's the story behind the graph?
Start with Day 1 and work across the data points in chronological order. As students contribute notes to the class graph, ask if others agree or if there are different explanations. Be sure students address the following questions in the annotations:
- Where does the weight come from?
- What changed and what stayed the same across time?
- Why did the changes happen?
When you have recorded the observable events in the life of the mini-lake, add notes that describe what was happening at the particle level.
How would we tell this "story" in terms of particles?
- Particles of water were tiny but close enough together so we could see the water.
- When salt dissolved, the particles became too small to see in the water.
- Some water particles left the mini-lake through evaporation and became water vapor that was part of the air.
- All of the original water particles are now water vapor - these particles are too small and spread apart to see.
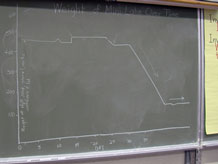
Point to the slope on the classroom graph that reflects evaporation from the mini-lakes:
This slope shows that a mini-lake lost approximately 150 grams over the course of about one week - or about 20 grams per day. What happened to this water?
- It became a gas called water vapor and moved into the air.
Point out that over the course of about one week, the collection of mini-lakes added more than 1500g of water — more than 1 1/2 liters of water — to the classroom air.
Can students imagine how much water moves into the air from a real lake each week?
Summarize the discussion
Ask a student to tell the story of the graph from beginning to end.
4. Connect mini-lakes and real lakes
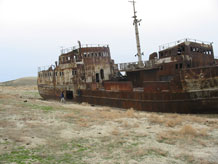
Staecker, via Wikimedia Commons
Show students the images of the Aral Sea ships, and highlight the similarities and differences between the mini-lakes and real lakes:
- The evaporation process is the same for both, with particles of water too small to see moving into the air to become water vapor.
- In most real lakes, the water that leaves through evaporation or streams is replaced by water from streams and by rain and snow.
- The mini-lakes lost water through evaporation but none of that water was replaced.
Give each student a copy of Why are these ships in a field? The Story of the Aral Sea, and then read the story as they follow along. Next, read the Letter from the Engineer, "Engineering and the Aral Sea".
Letter from the Engineer
Engineering and the Aral Sea
When people decided to use water from the Amu and Syr Rivers for watering cotton fields, they turned to engineers with the question: How can we move water from the rivers away from the Aral Sea and toward land that will be used to grow cotton? The engineers understood the problem they were asked to solve, and they designed canals — very long ditches — that would carry water from the two rivers to the future cotton fields. Their solution worked very well for the cotton farmers. Lots of water from the rivers went into the new canals and to the cotton fields, and much less water went into the Aral Sea. Farmers were now able to grow cotton in places that had always been much too dry (not enough rain) to grow crops.
But the canals also created problems. As the water in the Aral Sea evaporated, it was no longer replaced by river water. Furthermore, the salt did not evaporate. So the sea became more and more salty and eventually the fish died. For the fishermen, the new canals were not a solution, they actually created a new problem. And when so much water evaporated that most of the old sea dried up, the winds blew dust and salt from the old sea bottom into the air. Many people who lived nearby inhaled salt and dust into their lungs and became ill, so the new canals were not a solution for them either.
Did the people who decided to send water to the cotton fields think the Aral Sea would just stay the same? Did they forget about evaporation?
Engineering projects can often make peoples’ lives better in some ways, but they can also cause new problems if people are not careful to think about everything that will change as a result of a new project. Can you think of some things that have been designed to make life easier in some way but that also created problems?
(Possible responses include disposable items such as plastic water bottles; cars; leaf blowers.)