What's the story behind the graph?
3. Make Meaning
Purpose of the discussion
Students combine their notes on the classroom graph to explain the story behind the graph.
Engage students in the focus question
What's the story behind the graph?
Start with Day 1 and work across the data points in chronological order. As students contribute notes to the class graph, ask if others agree or if there are different explanations. Be sure students address the following questions in the annotations:
- Where does the weight come from?
- What changed and what stayed the same across time?
- Why did the changes happen?
When you have recorded the observable events in the life of the mini-lake, add notes that describe what was happening at the particle level.
How would we tell this "story" in terms of particles?
- Particles of water were tiny but close enough together so we could see the water.
- When salt dissolved, the particles became too small to see in the water.
- Some water particles left the mini-lake through evaporation and became water vapor that was part of the air.
- All of the original water particles are now water vapor - these particles are too small and spread apart to see.
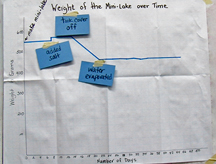
Point to the slope on the classroom graph that reflects evaporation from the mini-lakes:
This slope shows that a mini-lake lost approximately 150 grams over the course of about one week - or about 20 grams per day. What happened to this water?
- It became a gas called water vapor and moved into the air.
Point out that over the course of about one week, the collection of mini-lakes added more than 1500g of water — more than 1 1/2 liters of water — to the classroom air.
Can students imagine how much water moves into the air from a real lake each week?
Summarize the discussion
Ask a student to tell the story of the graph from beginning to end.