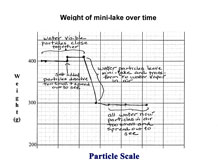
What's the story behind the graph?
1. Ask the question
Ask students to open their Science Notebooks to the graph they have created that records the weight of the mini-lake across time.
Today's investigation question is:
What is the story behind the graph?
Students will answer that question by annotating their graph, writing short notes directly on the graph and in the margins around it. These notes should tell the story of the mini-lake to someone who is not familiar with the work students have done over the past several weeks.
Note: The story of change in the mini-lakes can be told at different scales. At the visible scale, the terms dissolving and evaporation can describe most of the changes. However, students have started to learn what happens at the particle scale as these transformations occur. Emphasize that as students annotate their graphs, they should describe what is happening at both the visible level (salt dissolved, water evaporated, etc.) and at the particle level.
The graph shows changes in weight across time. Student notes should explain:
- Where the weight comes from?
- What changed and what stayed the same across time?
- Why the changes happened?
- Any other information students think will be helpful.
Students' notes should tell the story at two scales: at the visible scale (what we can see) and at the particle scale (things we can't see, but have learned about during the past few weeks.) You may choose to have students annotate events at the visible scale individually or in pairs and describe what happened at the particle level on the class graph in Step 3.
Students should make use of any notes they entered in their data table.


