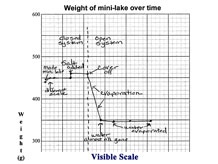
What's the story behind the graph?
2. Annotate the graphs
Mini-lake pairs should discuss the data and contribute ideas for annotating the graphs, but each student should annotate his or her own graph. It's not essential that everyone complete the annotations. The class will combine their notes on the large class drawing of a graph and students can continue to add notes to their own graphs at that same time.
Ask students to annotate observable changes such as the created of mini-lake, added salt, took off cover, water evaporated. They can also note explanations for the "shape" of the line. For example a horizontal line means the weight didn't change (no matter was added or taken away from the mini-lake), a line that slopes upwards shows that the weight increased (due to the addition of salt), a line that slopes downward indicates a loss of weight (due to evaporation of water).


