What's the story behind the graph?
Plan Investigation 17
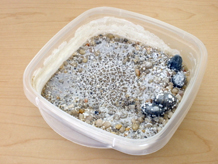
Students have kept track of their mini-lakes throughout this unit. They measured the contents, speculated on the changes that might occur over time, added salt, and tracked weight changes across time as the water evaporated. Today they tell the story of the mini-lakes by annotating their graphs. The annotations should allow someone unfamiliar with their work to understand the transformations of the mini-lakes at two different scales: the macroscopic or visible scale, and the microscopic or particle scale. Students then combine their annotations on a class graph. That sharing should result in a robust story that helps everyone strengthen their understanding of the mini-lake transformations.
Formative Assessment
Can students annotate their change over time graphs to explain changes in their mini-lakes?
Available online at inquiryproject.terc.edu

Can students annotate their change over time graphs to explain changes in their mini-lakes?
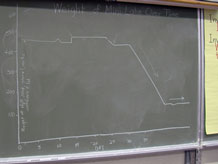
Look at students’ annotated graphs (Weight of mini-lake over time) and listen for evidence as they discuss the changes in the mini–lake weights.
Use these criteria to interpret students’ annotations and explanations:
- The shape of the data: A horizontal (flat) line represents no change in weight, a sloped line represents an increase or decrease in weight.
- When the mini–lake is a closed system (the cover is on), there is little or no change in weight (horizontal line).
- When salt is added, the weight increases immediately (line rises vertically).
- When the cover is removed, the weight decreases over time (downward sloping line) until there was no more water left to evaporate (horizontal line).
- Fluctuations in weight (+/- 1 gram) can be attributed to the inaccuracy of the scale.
- The weight of the water put in the mini-lake initially (in data table) is the amount of weight lost through evaporation.
As a next step, ask students if they can think of one or two ways the story of their mini-lake might be the same as the story behind the Ships in a Field.
Next students return to the mystery of the ship in the field. They read the story of the transformation of the Aral Sea, which has some interesting connections with the transformation of the mini-lakes: in both cases, the water that evaporated was not replenished. In both cases, sand, salt, and other solid earth materials were left behind.
By the end of this session students will have a deeper understanding of how the scientists' model of matter (matter made up of particles too small to see ) can explain familiar, everyday transformations such as evaporation, freezing, melting, condensation, and even the disappearance of water from a huge lake!
Learning Goals
- Understand that the particle model explains transformations of water at the visible level
| Sequence of experiences | ||
|---|---|---|
| 1. Ask the question | All Class | 10 Mins |
| 2. Annotate the graphs | Pairs | 10 Mins |
| 3. Share and discuss | Discussion | 15 Mins |
| 4. Connect mini-lakes and real lakes | All Class | 10 Mins |
Materials and Preparation
- Read the student resource Why are these ships in a field? The Story of the Aral Sea [in pdf format] (Available in the Resource Quick Links)
For the class:
- Post the investigation question in a place where all students can see it.
- Create an unlabeled reproduction of the mini-lake weight-over-time graph. This does not need to be scaled accurately.
- Set of images of ships in a field" or notebook pages. [in pdf format]
- Computer and a system for projecting the images if using electronic presentation.
For each student:
- 1 copy of Why are these ships in a field? The Story of the Aral Sea [in pdf format] (See Resources Quick Links)